正文
3.1 pandas 基本介绍
如果把 numpy 比作列表,pandas 可以比作字典
python import pandas as pd import numpy as np 创建 pandas 序列
python pd. Series ([ 1 , 3 , 6 , np.nan, 44 , 1 ]) # np.nan 相当于 None 0 1.0
1 3.0
2 6.0
3 NaN
4 44.0
5 1.0
dtype: float64
创建一个日期序列
python dates = pd. date_range ( '20160101' , periods = 6 ) dates DatetimeIndex(['2016-01-01', '2016-01-02', '2016-01-03', '2016-01-04',
'2016-01-05', '2016-01-06'],
dtype='datetime64[ns]', freq='D')
生成数据表格, pd.DataFrame(数据, 索引, 标题列表)
python pd. DataFrame (np.random. randn ( 6 , 4 ), index = dates, columns = [ 'a' , 'b' , 'c' , 'd' ]) 默认生成的数据表格
python pd. DataFrame (np. arange ( 12 ). reshape (( 3 , 4 ))) 用字典代替要输入的值
python df = pd. DataFrame ({ 'A' : 1 , 'B' : pd. Timestamp ( '20130102' ), 'C' : pd. Series ( 1 , index = list ( range ( 4 )), dtype = 'float32' ), 'D' : np. array ([ 3 ] * 4 , dtype = 'int32' ), 'E' : pd. Categorical ([ "test" , "train" , "test" , "train" ]), 'F' : 'foo' }) df 输出表格的类型
python A int64
B datetime64[ns]
C float32
D int32
E category
F object
dtype: object
输出表格的索引
python Int64Index([0, 1, 2, 3], dtype='int64')
输出表格的行名
python Index(['A', 'B', 'C', 'D', 'E', 'F'], dtype='object')
输出表格每行的数据
python array([[1, Timestamp('2013-01-02 00:00:00'), 1.0, 3, 'test', 'foo'],
[1, Timestamp('2013-01-02 00:00:00'), 1.0, 3, 'train', 'foo'],
[1, Timestamp('2013-01-02 00:00:00'), 1.0, 3, 'test', 'foo'],
[1, Timestamp('2013-01-02 00:00:00'), 1.0, 3, 'train', 'foo']],
dtype=object)
输出表格每行的数据特征
python 转置表格
python 排序表格
python df. sort_index ( axis = 1 , ascending = False ) # 以行排序,倒序 python df. sort_index ( axis = 0 , ascending = False ) python 3.2 pandas 选择数据
python import pandas as pd import numpy as np
dates = pd. date_range ( '20130101' , periods = 6 ) df = pd. DataFrame (np. arange ( 24 ). reshape (( 6 , 4 )), index = dates, columns = [ 'A' , 'B' , 'C' , 'D' ]) df 选择表格中 A 列的所有数据
python 2013-01-01 0
2013-01-02 4
2013-01-03 8
2013-01-04 12
2013-01-05 16
2013-01-06 20
Freq: D, Name: A, dtype: int32
python 2013-01-01 0
2013-01-02 4
2013-01-03 8
2013-01-04 12
2013-01-05 16
2013-01-06 20
Freq: D, Name: A, dtype: int32
选择表格中某些行中所有的数据
python python df[ '20130102' : '20130104' ] 根据标签选择数据
python A 4
B 5
C 6
D 7
Name: 2013-01-02 00:00:00, dtype: int32
python python df.loc[ '20130102' , [ 'A' , 'B' ]] A 4
B 5
Name: 2013-01-02 00:00:00, dtype: int32
根据位置选择数据
python A 12
B 13
C 14
D 15
Name: 2013-01-04 00:00:00, dtype: int32
python python python 混合选择表格中的数据
python df.ix[: 3 , [ 'A' , 'C' ]] # 高版本中已不推荐使用 ---------------------------------------------------------------------------
AttributeError Traceback (most recent call last)
Input In [27], in <cell line: 1>()
----> 1 df.ix[:3, ['A', 'C']]
File ~\anaconda3\lib\site-packages\pandas\core\generic.py:5575, in NDFrame.__getattr__(self, name)
5568 if (
5569 name not in self._internal_names_set
5570 and name not in self._metadata
5571 and name not in self._accessors
5572 and self._info_axis._can_hold_identifiers_and_holds_name(name)
5573 ):
5574 return self[name]
-> 5575 return object.__getattribute__(self, name)
AttributeError: 'DataFrame' object has no attribute 'ix'
是或否的筛选
python df[df.A > 8 ] # 只对比 A,但是 ABCD 都会显示 3.3pandas 设置值
python import pandas as pd import numpy as np
dates = pd. date_range ( '20130101' , periods = 6 ) df = pd. DataFrame (np. arange ( 24 ). reshape (( 6 , 4 )), index = dates, columns = [ 'A' , 'B' , 'C' , 'D' ]) python DatetimeIndex(['2013-01-01', '2013-01-02', '2013-01-03', '2013-01-04',
'2013-01-05', '2013-01-06'],
dtype='datetime64[ns]', freq='D')
python 修改表格中的值
python df.iloc[ 2 , 2 ] = 1111 df.loc[ '20130101' , 'B' ] = 2222 df[df.A > 4 ] = 0 df.B[df.A > 4 ] = 0 df 给表格中添加空的行
python python df[ 'E' ] = pd. Series ([ 1 , 2 , 3 , 4 , 5 , 6 ], index = pd. date_range ( '20130101' , periods = 6 )) df 3.4 pandas 处理丢失数据
python import pandas as pd import numpy as np
dates = pd. date_range ( '20130101' , periods = 6 ) df = pd. DataFrame (np. arange ( 24 ). reshape (( 6 , 4 )), index = dates, columns = [ 'A' , 'B' , 'C' , 'D' ]) df.iloc[ 0 , 1 ] = np.nan df.iloc[ 1 , 2 ] = np.nan df 丢弃 nan 数据
python df. dropna ( axis = 0 , how = 'any' ) # how = {'any', 'all'} 出现 nan/所有数据都是 nan 是才处理 将 nan 数据更改为其他值
python 判断表格中是否有缺失数据
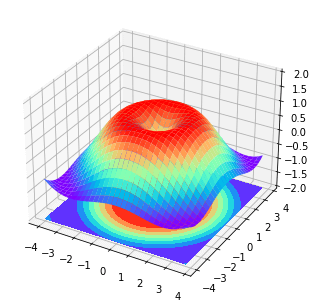
python python python np. any (df. isnull () is True ) # 若返回 True,则说明表格中的确缺失数据 3.5 3D 数据
python import numpy as np import matplotlib.pyplot as plt from mpl_toolkits.mplot3d import Axes3D
fig = plt. figure () # 新建一个 figure 窗口 ax = Axes3D (fig, auto_add_to_figure = False ) # 添加三维坐标轴 fig. add_axes (ax)
# 输入数据 X = np. arange ( - 4 , 4 , 0.25 ) Y = np. arange ( - 4 , 4 , 0.25 ) X, Y = np. meshgrid (X, Y) R = np. sqrt (X ** 2 + Y ** 2 ) Z = np. sin (R)
ax. plot_surface (X, Y, Z, rstride = 1 , cstride = 1 , cmap = plt. get_cmap ( 'rainbow' )) ax. contourf (X, Y, Z, zdir = 'z' , offset =- 2 , cmap = 'rainbow' ) ax. set_zlim ( - 2 , 2 )
plt. show () 3.6 pandas 合并 concat
python import pandas as pd import numpy as np concatenating
python df1 = pd. DataFrame (np. ones (( 3 , 4 )) * 0 , columns = [ 'a' , 'b' , 'c' , 'd' ]) df2 = pd. DataFrame (np. ones (( 3 , 4 )) * 1 , columns = [ 'a' , 'b' , 'c' , 'd' ]) df3 = pd. DataFrame (np. ones (( 3 , 4 )) * 2 , columns = [ 'a' , 'b' , 'c' , 'd' ]) python python python 上下合并
python pd. concat ([df1, df2, df3], axis = 0 ) # axis=0 竖向划分操作行,1 横向划分操作列 python pd. concat ([df1, df2, df3], axis = 0 , ignore_index = True ) # 重新排序索引 join, ['inner', 'outer']
python df1 = pd. DataFrame (np. ones (( 3 , 4 )) * 0 , columns = [ 'a' , 'b' , 'c' , 'd' ]) df2 = pd. DataFrame (np. ones (( 3 , 4 )) * 1 , columns = [ 'b' , 'c' , 'd' , 'e' ]) df1 python 直接合并出现的结果,会用 nan 填充
python pd. concat ([df1, df2], join = 'outer' ) python pd. concat ([df1, df2], join = 'inner' ) # 只会合并相同的部分 python pd. concat ([df1, df2], join = 'inner' , ignore_index = True ) 按照索引进行合并
python pd. concat ([df1, df2], axis = 1 , join_axes = [df1.index]) ---------------------------------------------------------------------------
TypeError Traceback (most recent call last)
Input In [23], in <cell line: 1>()
----> 1 pd.concat([df1, df2], axis=1, join_axes=[df1.index])
File ~\anaconda3\lib\site-packages\pandas\util\_decorators.py:311, in deprecate_nonkeyword_arguments.<locals>.decorate.<locals>.wrapper(*args, **kwargs)
305 if len(args) > num_allow_args:
306 warnings.warn(
307msg.format(arguments=arguments),
308 FutureWarning,
309stacklevel=stacklevel,
310 )
--> 311 return func(*args, **kwargs)
TypeError: concat() got an unexpected keyword argument 'join_axes'
append 将被移除,不推荐使用
python C:\Users\gzjzx\AppData\Local\Temp\ipykernel_10380\266511466.py:1: FutureWarning: The frame.append method is deprecated and will be removed from pandas in a future version. Use pandas.concat instead.
df1.append([df2, df3])
3.7pandas 合并 merge
python import pandas as pd
left = pd. DataFrame ({ 'key' : [ 'K0' , 'K1' , 'K2' , 'K3' ], 'A' : [ 'A0' , 'A1' , 'A2' , 'A3' ], 'B' : [ 'B0' , 'B1' , 'B2' , 'B3' ]}) right = pd. DataFrame ({ 'key' : [ 'K0' , 'K1' , 'K2' , 'K3' ], 'C' : [ 'C0' , 'C1' , 'C2' , 'C3' ], 'D' : [ 'D0' , 'D1' , 'D2' , 'D3' ]}) python python python pd. merge (left, right, on = 'key' ) 在有两个 key 的情况下
python left = pd. DataFrame ({ 'key1' : [ 'K0' , 'K0' , 'K1' , 'K2' ], 'key2' : [ 'K0' , 'K1' , 'K0' , 'K1' ], 'A' : [ 'A0' , 'A1' , 'A2' , 'A3' ], 'B' : [ 'B0' , 'B1' , 'B2' , 'B3' ]}) right = pd. DataFrame ({ 'key1' : [ 'K0' , 'K1' , 'K1' , 'K2' ], 'key2' : [ 'K0' , 'K0' , 'K0' , 'K0' ], 'C' : [ 'C0' , 'C1' , 'C2' , 'C3' ], 'D' : [ 'D0' , 'D1' , 'D2' , 'D3' ]}) left python python pd. merge (left, right, on = [ 'key1' , 'key2' ], how = 'inner' ) python pd. merge (left, right, on = [ 'key1' , 'key2' ], how = 'outer' ) python pd. merge (left, right, on = [ 'key1' , 'key2' ], how = 'left' ) python pd. merge (left, right, on = [ 'key1' , 'key2' ], how = 'right' , indicator = True ) # indicator 显示合并的方式 python pd. merge (left, right, on = [ 'key1' , 'key2' ], how = 'right' , indicator = "indicator_column" ) # indicator 显示合并的方式 python pd. merge (left, right, left_index = True , right_index = True , how = 'outer' ) 处理合并造成的重复问题
python boys = pd. DataFrame ({ 'k' : [ 'K0' , 'K1' , 'K2' ], 'age' : [ 1 , 2 , 3 ]}) girls = pd. DataFrame ({ 'k' : [ 'K0' , 'K1' , 'K2' ], 'age' : [ 4 , 5 , 6 ]}) boys python python pd. merge (boys, girls, on = 'k' , suffixes = [ '_boy' , '_girl' ], how = 'inner' ) 3.8 pandas plot 画图
python import pandas as pd import numpy as np import matplotlib.pyplot as plt 0 0.682404
1 1.833947
2 2.639884
3 1.843226
4 3.675730
...
995 72.472419
996 70.507220
997 70.897704
998 71.912970
999 71.542112
Length: 1000, dtype: float64
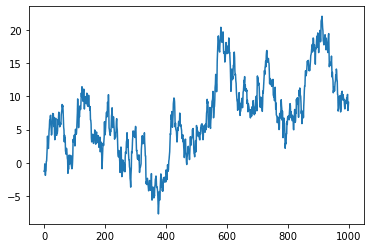
Series 折线图
python data = pd. Series (np.random. randn ( 1000 ), index = np. arange ( 1000 )). cumsum () data 0 -1.287330
1 -1.293898
2 -0.166798
3 -1.177414
4 -1.890751
...
995 10.204522
996 10.308410
997 7.887580
998 8.327458
999 9.105820
Length: 1000, dtype: float64
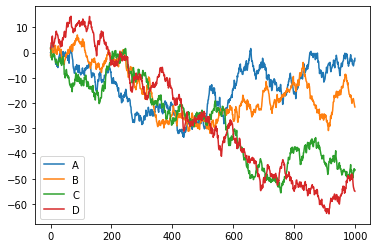
python DataFrame 折线图
python data = pd. DataFrame (np.random. randn ( 1000 , 4 ), index = np. arange ( 1000 ), columns = list ( 'ABCD' )). cumsum () data python
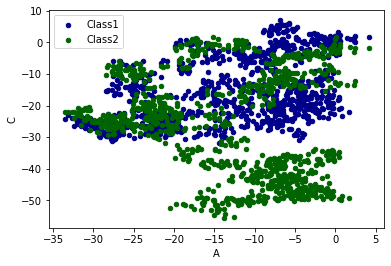
plot 的方法:bar 条形图,hist,box,kde,area,scatter,hexbin,pie……
python ax = data.plot. scatter ( x = 'A' , y = 'B' , color = 'DarkBlue' , label = 'Class1' ) data.plot. scatter ( x = 'A' , y = 'C' , color = 'DarkGreen' , label = 'Class2' , ax = ax) plt. show ()